Understanding body composition is essential for health management. Millions use body composition analyzers to track fitness and health. However, many struggle with how to read body composition analyzer results effectively. According to the American Council on Exercise, body composition is a crucial indicator of physical fitness and overall health.
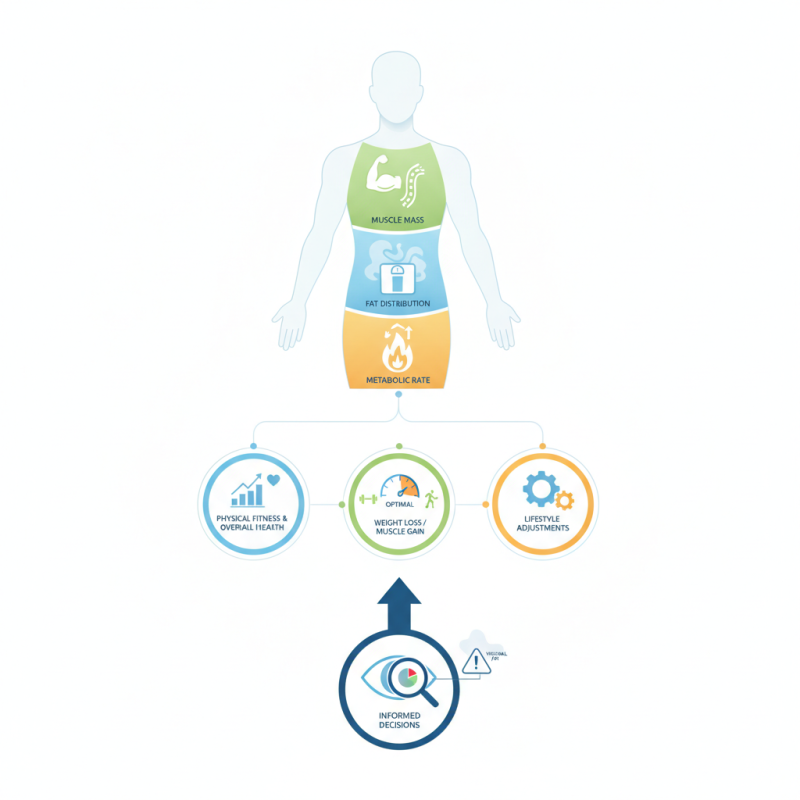
Studies indicate that body composition measurements can provide insights into muscle mass, fat distribution, and metabolic rate. These factors are vital, especially for individuals striving for weight loss or muscle gain. Yet, interpreting the results can be confusing. A report by the Journal of Obesity reveals that misinterpretation can lead to setbacks in achieving fitness goals.
The body composition analyzer results provide more than just numbers. They should prompt reflection and necessary adjustments in lifestyle. Users often overlook important metrics, such as visceral fat, which can influence long-term health. Gaining a full understanding of how to read body composition analyzer results can empower users to make informed decisions, ultimately enhancing their health journey.
Body composition analyzers are vital tools in the fitness and health industry. They provide insights into key metrics, including body fat percentage, muscle mass, and water retention. Understanding these metrics can help individuals tailor their fitness and nutrition plans. According to the National Institutes of Health, an optimal body fat percentage for men ranges between 10-20%, while for women, it ranges from 18-28%.
However, the results from these devices can sometimes be misleading. Depending on hydration levels and recent physical activity, the readings may vary. It’s important to interpret these results within the context of lifestyle, age, and overall health goals. A 2020 study published in the Journal of Clinical Nutrition highlighted that over-reliance on body composition metrics can lead to misinterpretations of one’s health status.
Individuals should view these results as a piece of the puzzle, not the entirety. Consulting with healthcare professionals can provide clarity. Ultimately, understanding how to use these results effectively requires both knowledge and experience, ensuring you get the most accurate picture of your health.
| Body Composition Metric | Standard Range | Your Result | Interpretation |
|---|---|---|---|
| Body Fat Percentage | 10% - 20% | 18% | Normal range; healthy fat levels. |
| Muscle Mass | Lean Mass Percentage | 45% | Healthy muscle mass; needs maintenance. |
| Total Body Water | 50% - 65% | 57% | Well-hydrated; adequate fluid levels. |
| Bone Mass | 2% - 5% | 3% | Normal bone density; no concerns. |
Body composition analyzers provide various metrics that can help users understand their body composition better. Key metrics include body fat percentage, muscle mass, and water content. Each of these figures offers distinct insights. For instance, a high body fat percentage may indicate a need for dietary changes. In contrast, an increase in muscle mass could suggest effective strength training.
Moreover, hydration levels are critical. Analyzers often report total body water as a percentage. This data can indicate whether someone is properly hydrated. Low water content may lead to fatigue and reduced physical performance. Users should regularly monitor these metrics to track changes over time. However, one must be cautious about interpreting single readings.
Sometimes the results may fluctuate due to factors like hydration or meal timing. This can lead to misinterpretation. It’s vital to consider overall trends rather than fixate on occasional highs and lows. A good understanding of these metrics empowers individuals to make informed lifestyle choices. However, results can sometimes be misleading, requiring a more profound reflection on one’s health habits.
Interpreting body composition analyzer results requires a keen understanding of key metrics. One of the most important figures is body fat percentage. This number reveals how much fat your body carries compared to your total weight. A higher percentage may indicate an increased risk for health issues. It’s essential to look beyond the number and consider personal context. Factors like age, sex, and fitness level play a crucial role in interpretation.
Muscle mass is another critical indicator. This figure helps assess your overall strength and fitness. More muscle mass usually indicates a higher metabolic rate. However, bodybuilding goals may not apply to everyone. Some might prioritize endurance or flexibility over sheer muscle gain. Understanding your personal fitness goals is vital in interpreting these results accurately.
Reflect on how your body composition aligns with your lifestyle and make adjustments accordingly. This offers a clearer picture of your health journey.
Body composition analysis is a useful tool for understanding personal health. However, several factors can significantly influence the measurements. For instance, hydration levels play a crucial role. A study by the American Council on Exercise highlighted that fluctuations in water intake can alter body fat readings by up to 5%. This variability can mislead individuals about their actual fitness levels.
Another important aspect is the time of day when measurements are taken. Research indicates that body composition readings can vary based on whether they are conducted in the morning or the evening. This fluctuation is attributed to food intake and daily physical activities. People often overlook the impact of recent workouts too; intense exercise can temporarily affect muscle mass readings in body analyzers.
Moreover, the effect of age and gender cannot be ignored. Studies reveal that muscle mass decreases with age, influencing fat percentage calculations. Females typically have a higher body fat percentage due to biological factors. These elements underscore the complexity of interpreting body composition results. Individuals need to be cautious and aware of these variables. Relying solely on numbers may lead to misconceptions about health and wellness.
Understanding body composition results can guide you in setting achievable health goals. For example, a study published in the Journal of Obesity shows that tracking body fat percentage can correlate with improved metabolic health. When your analyzer reports body fat, muscle mass, and water percentage, consider where you stand in relation to healthy ranges established by organizations like the American College of Sports Medicine.
Interpret your results critically. For instance, the ideal body fat percentage varies by age and gender. A 25% body fat reads differently for a 30-year-old woman than for a 50-year-old man. Use these insights to personalize your fitness and nutrition strategies. If you're below average in muscle mass, explore strength training. If hydration levels are low, increase your water intake.
Research indicates that only 30% of gym-goers set specific, measurable goals. Reflect on your own practice. Are your objectives clear? Use data from your analysis to create personalized, realistic targets. Sometimes, progress is not linear. If you don't see immediate results, adjust and focus on consistent effort. Emphasizing gradual improvements is key to long-term success.
This bar chart illustrates the body composition results of an individual focusing on body fat percentage, muscle mass, and water content. These metrics help in setting informed health and fitness goals.
: They provide insights on body fat percentage, muscle mass, and water retention.
Understanding these metrics can help tailor your fitness and nutrition plans effectively.
Readings can vary due to hydration levels and recent physical activity, making them tricky to interpret.
View the results as part of your overall health picture, not the whole story.
Analyze where you stand concerning healthy ranges and adjust your fitness strategies accordingly.
Single readings can mislead. Focus on overall trends rather than occasional highs and lows.
If water content is low, increasing your daily water intake can help.
Yes, but they vary by age and gender, so consider your personal context.
Regular monitoring helps understand trends, but don’t obsess over single measurements.
Progress can be gradual. Reflect on your goals and focus on consistent efforts for success.
Understanding how to read body composition analyzer results is essential for making informed health and fitness decisions. Body composition analyzers provide a range of metrics, including body fat percentage and muscle mass, which help individuals assess their overall health status. Key results can reveal insights into body composition changes and trends over time, allowing for tailored health and fitness goals.
However, it’s important to consider various factors that can influence these measurements, such as hydration levels and recent physical activity. To effectively use body composition data, individuals should set realistic health goals based on accurate interpretations of their results, ensuring a balanced approach to fitness and nutrition. By grasping these essential elements, one can optimize their health journey through informed decisions derived from body composition analysis.
OneSe Beauty